Why This Question?
My research was originally born out of a desire to accurately model the 2024 USA presidential election using real-world polling data. However, once the model was built, I became fascinated by a deeper, more structural question: why are we limited to two choices when so much of the electorate feels unheard? This led me to explore the "optimal" number of parties—the point where voter representation is maximized without falling into the chaos of fragmentation.
In the real world, we see the US struggling with two-party gridlock and negative partisanship, while many European multi-party systems face different challenges with coalition-building. I wanted to use agent-based modeling to see if there is a mathematical "sweet spot" that makes voters the most "happy" in aggregate. By shifting the focus from who wins to how well the winner represents the people, we can better understand the structural failures of our current systems.
How the Model Works
At the heart of the simulation is a 10-dimensional "ideology space." Rather than a simple left-vs-right line, each voter and party is assigned a vector of ten values ranging from -1.0 to 1.0. These dimensions represent distinct policy areas like the economy, climate, and defense. This multi-dimensional approach allows the model to capture "cross-pressured" voters—for example, someone who might be fiscally conservative but socially progressive—who are often ignored in standard two-party models. NOTE - THESE ISSUES ARE JUST ANALOGOUS, THE ISSUES BELOW ARE JUST EXAMPLE REPRESENTATIONS. The issues can realistically just be viewed as Issue 1, Issue 2...
Voters are generated in clusters to mimic real-world demographics. "Democrat" and "Republican" shares represent partisan bases, while the "Center" share represents moderates and "Cross" share represents voters with high variance across dimensions. The simulation also accounts for turnout variability based on "firmness"—a measure of how far a voter's views are from the neutral center. Essentially, the more passionate or "firm" a voter is in their views, the more likely they are to show up at the polls.
turnout_chance = 0.4 + (firmness / 2)
"Firmness" is calculated as the Euclidean distance of a voter's 10D vector from the origin (neutral center). Conceptually, this formula ensures that ideological moderates are less likely to vote than partisans. This mirrors the real-world "Trump effect" or "polarization boost," where extreme candidates can drive higher turnout among their base while alienating the moderate center.
Key Findings
Finding 1 — Optimal Party Count
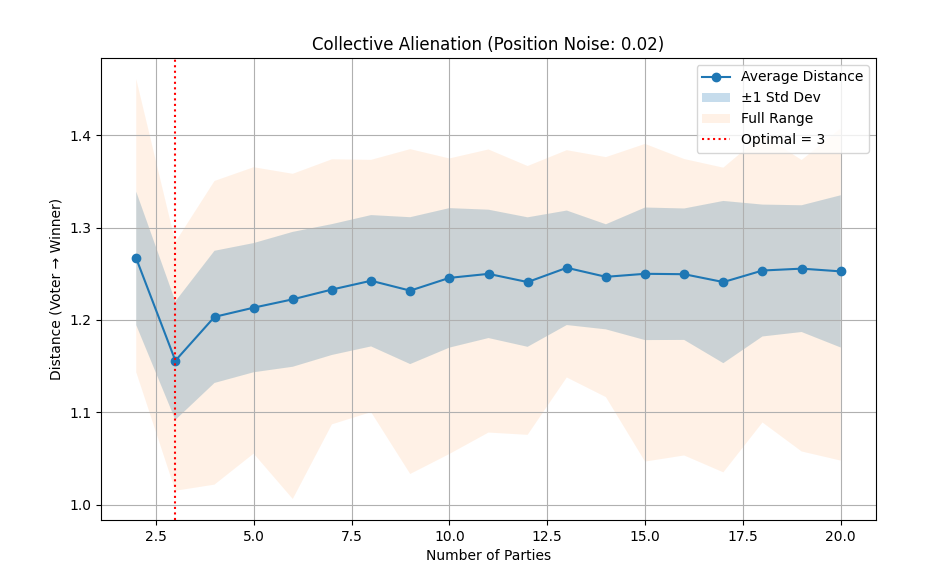
The most striking result from the model is that a 3-party system consistently minimizes "collective alienation"—the average distance between voters and the winning party. While I initially hypothesized that more choice (5+ parties) would always be better, the data showed that after 3 parties, the system begins to fragment. Adding more parties actually increases the average distance to the winner because the vote splits so much that a party with very narrow appeal can win, leaving the majority of the electorate feeling unrepresented.
Finding 2 — Third Party Dynamics
When introducing an adaptive third party into a two-party simulation, the model highlights the crushing power of negative partisanship. Conceptually, voters are often driven more by fear of the "other" side than by love for their own. This creates a barrier where a perfectly reasonable third party struggles to gain traction because voters fear "wasting" their vote and inadvertently helping the candidate they dislike the most. However, when the third party does adapt, it significantly improves representation for centrist and cross-pressured voters.
Finding 3 — Noise & Robustness
I tested the model's sensitivity to "position noise" (ε = 0.02), which represents the fact that parties don't always perfectly align with their stated ideologies. Interestingly, the "Rule of 3" remained robust across different noise levels. Even as the system becomes more chaotic or parties shift their positions, the three-party configuration consistently remains the most efficient way to maximize collective voter happiness before hitting diminishing returns.
| Parties | Avg Distance | Notes |
|---|---|---|
| 2 | 1.2667 | Significant Alienation |
| 3 | 1.1560 | Optimal Representation |
| 4 | 1.2034 | Gains Lost to Fragmentation |
| 5 | 1.2134 | — |
| 6 | 1.2224 | — |
| 10 | 1.2456 | High Noise/Instability |
| 20 | 1.2526 | Returns to 2-party levels |
Limitations & Caveats
While this model provides valuable mathematical insights, it is an abstraction of reality. The 10D ideology space assumes that all issues have equal weight, whereas real-world voters often prioritize single issues like the economy or healthcare over all else. Furthermore, the model currently lacks geographic structure—it doesn't account for the Electoral College or the way voters are concentrated in specific cities or states, which is a major factor in US elections.
I also haven't yet modeled the influence of "big money," media echo chambers, or the incumbency advantage, all of which heavily distort the "optimal" mathematical outcome in the real world. Finally, while I use "collective alienation" as my primary metric, other metrics—like legislative stability or economic performance—might lead to different conclusions about what system is "best."